Kelley A. Bergstrom Real Estate Center
Writing the commercial real estate playbook
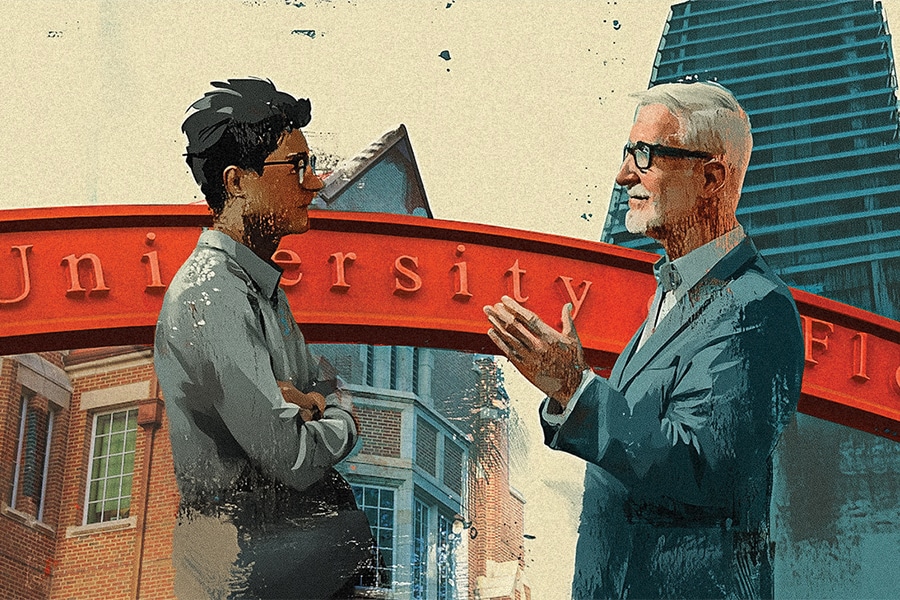
Turning cap rates into case studies — where students, scholars and dealmakers share the same floor plan. The Kelley A. Bergstrom Center’s mission is to uncover data-driven insights that shape real estate practices and policies, while empowering the next generation of professionals through mentorship.
The Kelley A. Bergstrom Center is an academic hub known for the intellectual output of its faculty, it’s visionary board, and loyal alums (comprised of top industry leaders) all of whom spearhead what can only be called a cornerstone of the Warrington College of Business.
By integrating academic excellence with practical application, the Kelley A. Bergstrom Center plays a vital role in both scholarly advancement and the career success of students.
About us
Our story began over 50 years ago, and our presence has expanded steadily since. Today, the center is named after Kelley A. Bergstrom, who in 2006 created an endowment to support our work. Guided by Warrington faculty and our Advisory Board, we’ve grown into a powerhouse for University of Florida students, alumni and industry professionals.
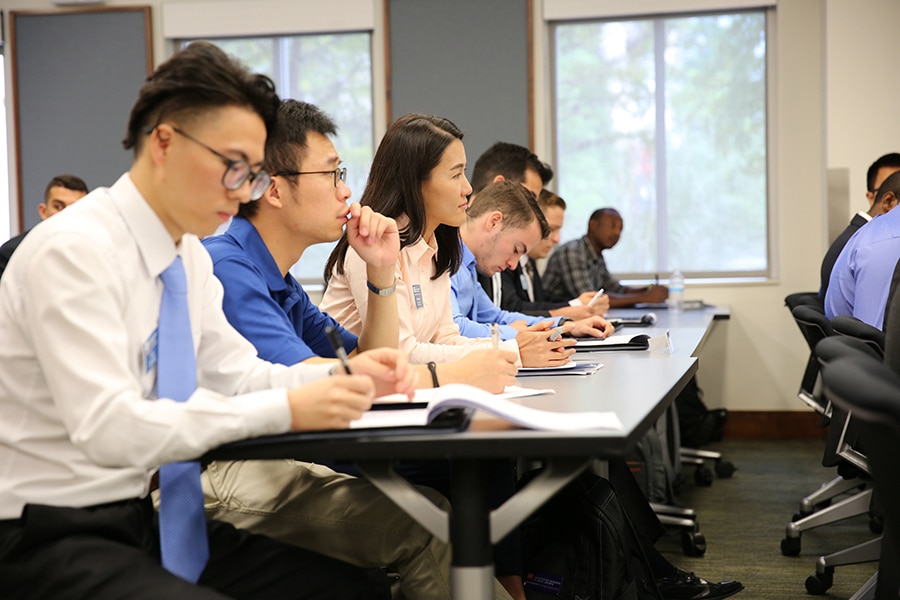
Real estate education
Yesterday’s tactics don’t yield the results you’ll chase tomorrow. Through industry input and faculty research, the MS in Real Estate, BABA specialization, and undergraduate minor reflect how professionals sell, invest and get new projects off the ground right now.
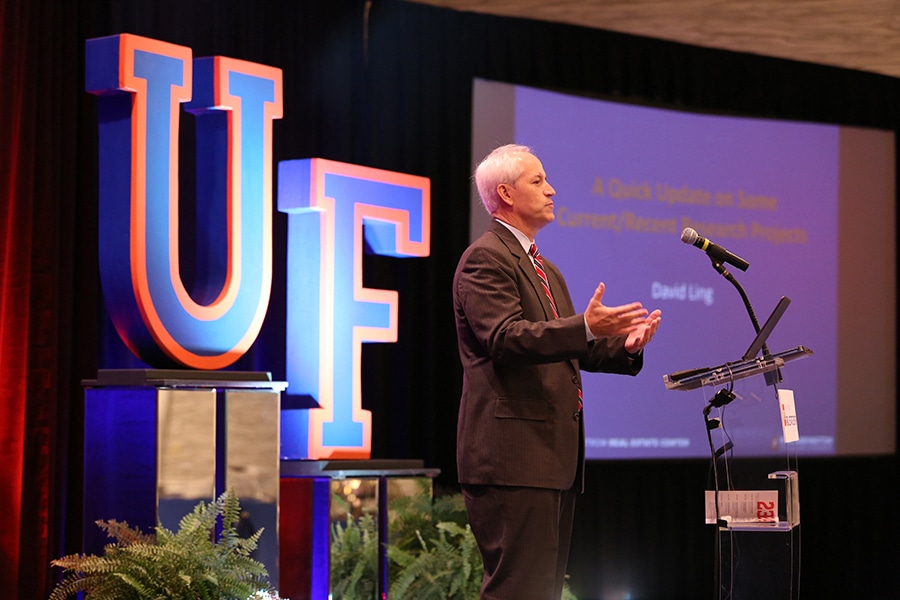
Real estate research
Through our applied and academic research the Kelley A. Bergstrom Center strives to advance thought leadership. Faculty contribute to scholarly papers, books, presentations, and our publication Due Diligence, they are also regular recipients of grants.
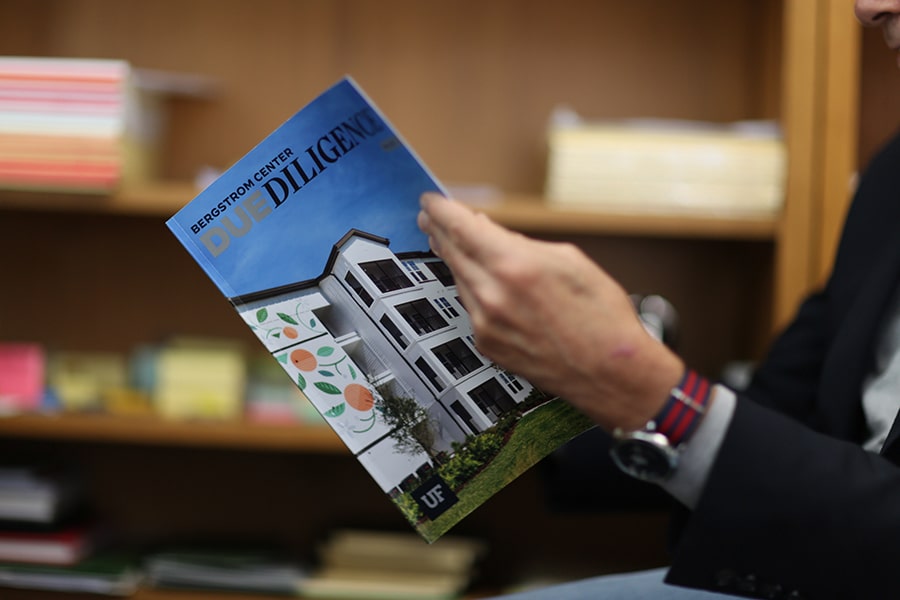
Due Diligence
What does the market look like? Due Diligence — the Bergstrom Real Estate Center’s bi-annual publication — projects industry trends involving technology use, insurance, natural disasters, and other factors that impact property sales and land development.
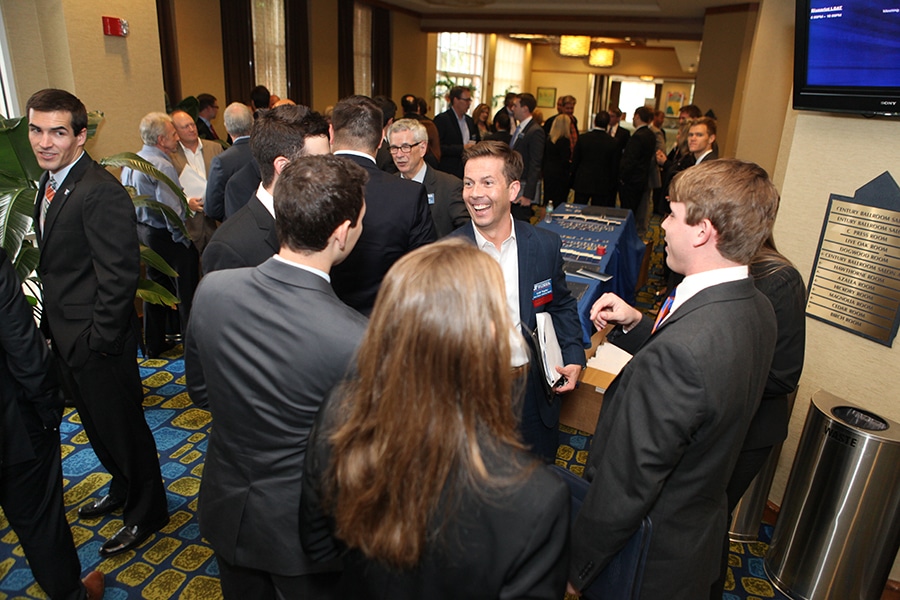
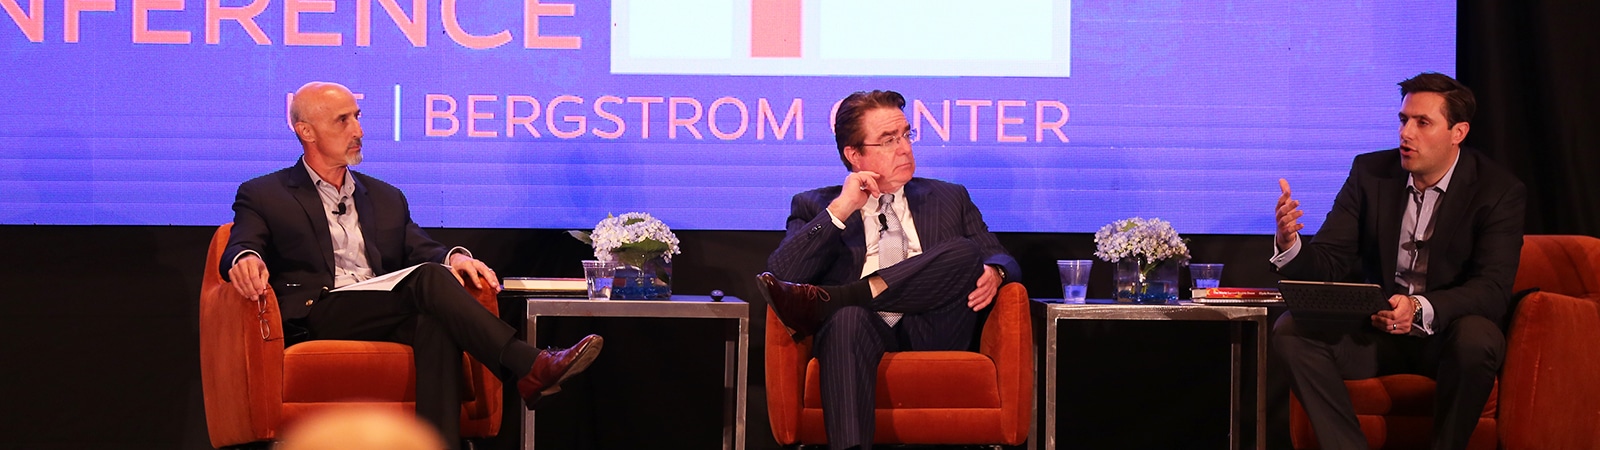
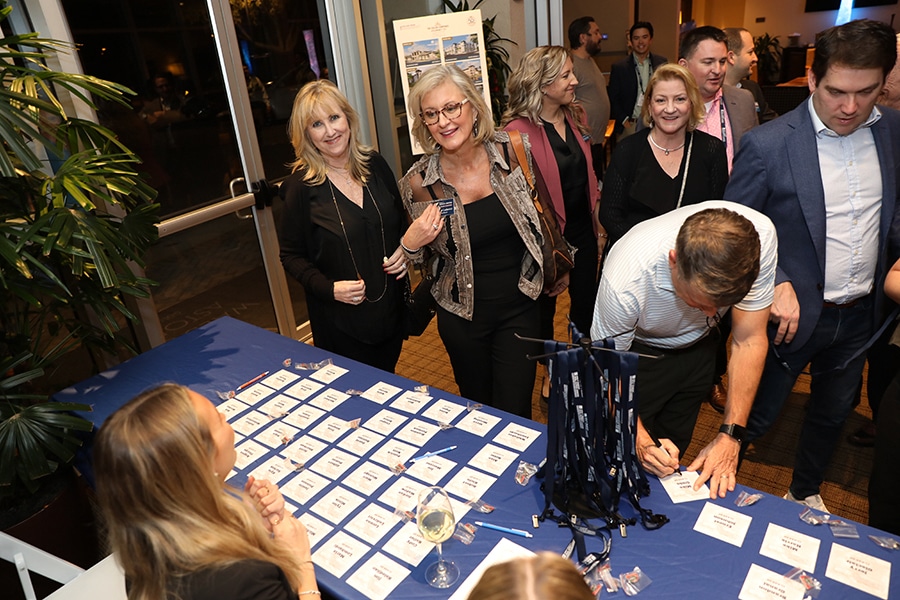
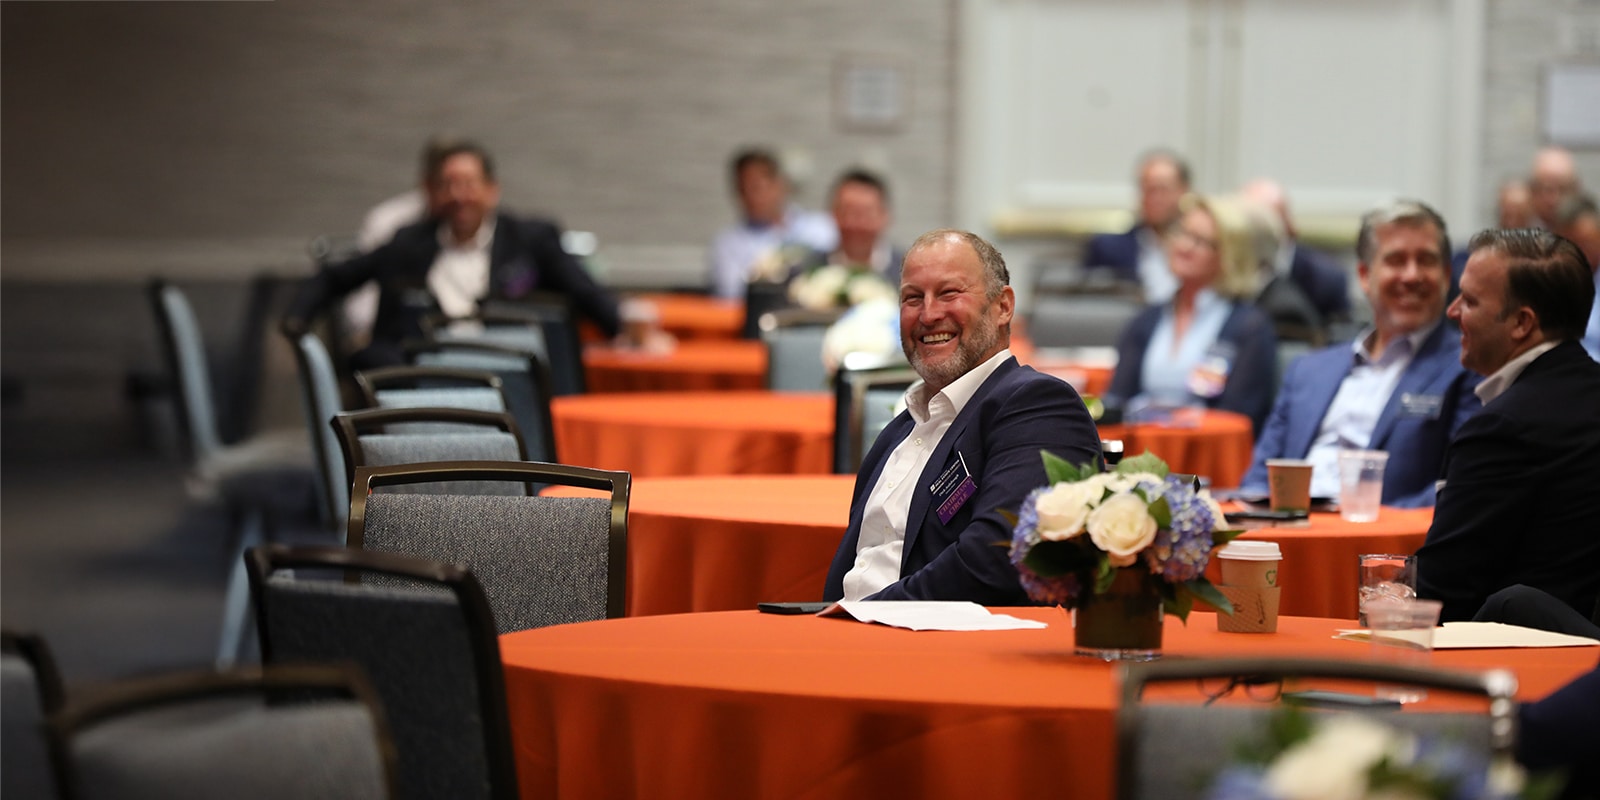
Our mission in action
Our Real Estate Trends and Strategies Conference, the Ring Speaker Series, and our Advisory Board encourage an active exchange of both scholarly and professional information from the field. Students in turn are guided by professional know-how.
Recognition
From our graduates to our state’s market, our Hall of Fame, Alumni of the Year, and Lifetime Service Awards recognize professionals driving real estate forward.
Guided by industry expertise
The Kelley A. Bergstrom Center is generously supported by the real estate community at large. Our Chairman’s Circle, Advisory Board, and Friends of the center are at the heart of our operations.
Discover the Kelley A. Bergstrom Center
Build your network at any stage, find a new hire or make a donation that supports the success of current Warrington College of Business students.
Upcoming events
The latest Due Diligence articles


The latest Bergstrom Center news


What’s your perspective?
As we pioneer new ideas and empower all real estate professionals, add your voice to the dialogue and leave your mark.
Contact us
Kelley A. Bergstrom Real Estate Center
Warrington College of Business
University of Florida
Phone: 352-273-0311
Fax: 352-392-0301
Email the Bergstrom Center