
Sea Levels Around the Florida Coast
Don’t Panic – But Plan
No accusations, no admonishment, no requests to reverse progress, no blame, no trend extrapolation. Instead, let’s look at measured historical results and form a plan to protect our assets.
In recent years, there have been many discussions and predictions about the future state of Florida’s coastal property. Some boldly predict full submergence by 2050, while others refuse to acknowledge it’s happening at all. This article does not focus on the whos, hows, or whys that floods or storms occur but rather it will only convey what is factually observable. For whatever reason, sea levels are rising, not consistently but persistently. As homeowners, investors, and/or real estate professionals, we should reasonably evaluate the conditions and plan to address potential risks.

For context, the US Department of Commerce established the Nation Oceanic and Atmospheric Administration (NOAA) in 1970 with the purpose of understanding and predicting changes in climate, weather, oceans, and coasts. Three environmental science agencies were combined at NOAA’s inception, allowing them access to data dating back to the late 1800s. All information collected by the agency is readily accessible to the public and one collection of these data includes monthly mean sea-level reports from various points across the US.
Data regarding sea-level are monitored and recorded by 210 long-term Tide Stations within the National Water Level Observation Network (NWLON). The stations house a tide gauge, which is fitted with sensors that send an audio signal down a half-inch wide “sounding tube” and measure the time it takes for the reflected signal to travel back from the water’s surface. The process is repeated every six minutes and the recorded data are then electronically transmitted through a Geostationary Operational Environmental Satellite.
Out of the 210 total long-term stations, 22 are located along the Florida coast. For our research, we selected 3 stations from different areas of the state – St. Petersburg along the Gulf, Mayport facing the Atlantic near Jacksonville, and Key West on the southernmost point of the nation.
To eliminate seasonal fluctuations due to ocean temperatures, salinities, winds, currents, etc., data sets are all calibrated to a specified datum. This datum is a base elevation used as a reference from which to ascertain heights or depths. Each station has a unique datum, called the Mean Lower Low Water (MLLW) point. This point is the lowest point measured over a fixed period, called the National Tidal Datum Epoch, and is set to zero to act as the baseline for measures during the following epoch. A new MLLW datum is calculated every epoch, which is a 19-year tidal cycle tied to the regression of the moon’s nodes that takes 18.6 years to complete.
Now, to fully understand the water-level around the state, it is important to review data from more than one station along the coast. Even though there is one contiguous body of water, the coastal structure and location of the station will influence the amount of water needed to move the surface level by a given distance. For example, along a flat, wide beach the water can spread over a larger area, resulting in a tidal range of only a few centimeters. On the other hand, in a confined, narrow inlet or bay, the tidal range could be up to multiple meters. Keep this in mind, as we will see significantly different sea-level changes across our three stations.
From the sample stations we selected, the earliest recording date was 1913 for Key West, 1928 for Mayport, and 1947 for St. Petersburg. To achieve consistent comparisons, we established our primary study period to range from 1980 to 2020. From the monthly data taken directly from the NOAA site, we calculated average annual sea-level estimates as displayed in the charts. All data points collected prior to the current epoch cycle are adjusted relative to the most recent datum. Therefore, these numbers are calibrated to a consistent baseline.
Figure 1
Figure 2
Figure 3
Off the Atlantic coast, the overall change in Mayport’s sea-level from 1980 to 2020 is 9.59 inches. The St. Petersburg station and the Key West station experienced a 7.38 inches and 6.82-inches rise respectively over the same period. As foreshadowed, the total sea-level change over this timeframe differs among the stations. In fact, the difference between level change at the Key West station and the Mayport station is greater than 2.5 inches or 40% of the total change at Key West. It is critically important when comparing measurements that they are taken from the same station over time. It is also important that the measurements from a given station only be used to describe conditions within the local area and not applied to conditions across the state.
These observed, direct sea-level measurements present an undeniable upward trend at all 3 stations. Before we become too alarmed or too defensive, we need to put these charts into perspective. The charted lines are clearly sweeping upward as time advances but the magnitude, consistency, and persistence of these figures are important factors.
It is also important to note that there is a significant degree of volatility in the sea-level charts throughout history. The path of each line in the three charts is anything but smooth. Year by year the average sea-level rises and falls. Furthermore, the patterns are not exactly the same across all stations – 2015 was an up year at Key West and St. Petersburg but showed no change at Mayport. Although the cumulative pattern is increasing over time, the growth is not consistent over time or across stations. This lack of consistency dilutes attempts to simply match events to sea-level change. However, it does not refute the general upward trend.
Figure 4
To further examine the changes in water-level, we grouped the level change data by decade and calculated the average change in sea-level per year. Each station returned varying results, which are depicted in the graph. Mayport appears to have been the most volatile of the three stations, having the largest positive and negative changes over each decade. St. Petersburg and Key West readings are mostly consistent with each other, but Key West had a larger magnitude of both positive and negative change over each decade. This chart also depicts one similarity across all three stations – from 2010-2020 water levels sharply increased at each location.
The decade chart reveals that the observed change in sea-level has not been consistent over time. Since 1950, both Mayport and Key West stations experienced periods of 10-years where the cumulative change was either positive or negative. St. Petersburg has not had a decade of cumulative sea-level decline, but the rate of rise has varied quite a bit. However, the overall trend has persisted in a positive fashion. The line charts of annual change and the column chart of decade change all show that the cumulative change over long periods has been positive. Thus, the sea-level around the state of Florida has undoubtedly risen over the measured period for each station.
Now, let’s put the magnitude of this sea-level rise into context. It is important to note that the tides themselves are very cyclical. As represented in the tide chart displayed for the Mayport station, the tide level changes multiple times throughout a single day. The vertical difference between high and low tide is called the tidal range. Since the Earth’s surface is not uniform, tides do not follow the same pattern across the globe. Just as with the sea-level measurements, the shape of a coast and ocean floor both make a difference in the range and frequency of the tides. Furthermore, the level reached at low or high tide differs between the morning and afternoon tides. These tidal movements highlight the challenge in measuring a sustained change in sea-level.
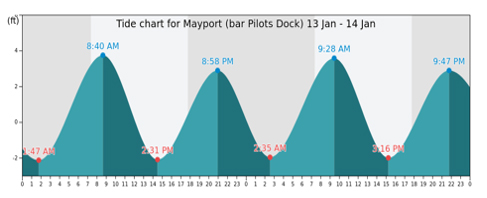
Figure 5: Tide chart for Mayport (bar Pilots Dock) 13 Jan – 14 Jan (Source: Tides Chart)
Due to the variability in tidal ranges, we relied on NOAA’s calculation of the mean range of tide – which is the difference in height between mean high water and mean low water over the most recent epoch. We averaged the mean range of tide values using the data provided for all Florida tide stations, which resulted in an average range of 25.93 inches (2.16 feet) per day.
Now consider the magnitude of the sea-level change described earlier. The rise in sea-level averaged approximately 0.20 inches a year for the past 40 years. With daily tide fluctuations of two feet or more, a fifth of an inch does not seem all that noteworthy. However, this low rate of rise persisting over a sustained period leads to an irrefutable build-up of water along the coast. The next question might be – When will this impact our real estate?
Arnoldo Valle-Levinson, a civil and coastal engineer, and Jonathan B. Martin, a geological scientist, both at The University of Florida, recently published a paper of importance to coastal property owners. In their study entitled Solar activity and lunar precessions influence extreme Sea-level variability in the U.S. Atlantic and Gulf of Mexico coasts, they map inundation events to sun and moon effects. They discovered that ‘the combined influence of frequencies derived from lunar precessions and solar activity yields a record that coincides with observations of extreme sea levels.’
When they considered combined data on solar and lunar orbits with records of historically high sea levels, they found abnormally high incidents of flooding occur during certain periods of solar/lunar precessions. Their research shows evidence of strong correlations between historic water-level peaks in the 1940s, 1970s, and post 2011 and reconstructed frequencies using the harmonics derived from solar and lunar activity periods. Although the connection between moon phases and tides was identified centuries ago, it is the complex combination of the moon’s position and solar activity that yields a very high correlation with coastal inundation.
Using the relationships identified in their research, Valle-Levinson and Martin are able to predict periods with the potential of extreme high-tide flooding events. There is an increased probability of these events occurring around 2028-29, 2052, 2064, 2072, and 2098. Knowledge of these celestial conditions combined with our understanding that the sea-level is creeping up the Florida coast suggests that during certain years we should expect increasingly impactful inundation. This does not imply that the state will be submerged like Atlantis but rather that the occasional flooding events that we experience will intensify during these specific years.
We do have tools, some known and some in development, to address temporary flooding. Improved drainage, better coastal property management, sea walls, or even pumping systems can be designed to reduce the effects of approaching water. However, these tools, along with tools yet to be developed, cost money. Why should property owners or, more importantly, entire communities dedicate resources to water control?
According to the Florida Department of Revenue, as of 2019, just over 80 percent of the state’s total real property value is related to properties located in coastal counties. This is a bit over $2 trillion, a number that further amplifies the potential widespread impact of a rise in sea-level. Protecting the future use of this magnitude of real estate assets warrants a material investment. Understanding the persistence of sea-level rise, coupled with an awareness of scientific predictions, such as the Valle-Levinson and Martin study, better equips real estate investors and owners alike to prepare for and reduce coastal property risk. If we objectively consider the existing data before us, it seems that we need not panic – but we should certainly develop mitigation plans.
Being proactive about future risks can save considerable effort and resources – every $1 spent on disaster mitigation saves $6 in disaster relief according to a 2019 report by the National Institute of Building Sciences. At the owner level, things such as purchasing extensive flood insurance or elevating outdoor electrical equipment can save individuals time and money in the future. From a local perspective, cities can build seawalls and stormwater pumps, raise roads, or upgrade sewage systems. Furthermore, beaches and coastal ecosystems can be manufactured to act as natural barriers that reduce the impact of storm surges.
Unfortunately, past attempts at restoring coastal ecosystems have often failed because they did not fully consider the properties required to sustain a population. However, the University of Florida’s Center for Coastal Solutions Director, Dr. Christine Angelini, recently contributed to an international study regarding coast restoration using biodegradable mats11. The group created biodegradable mats made with the by-products of potato processing and found the mats can protect seagrass or marsh plants as they grow by mimicking roots, and then eventually they disappear when the plants are strong enough. This type of innovation is just one example of environmentally sustainable water-level management, and real estate professionals are advised to keep up to date on similar creative solutions that emerge in the future.
Sea-level is a widely studied and hotly debated issue. Our goal is to remove the wild projections that tend to incite fatalistic fear or complete denial and focus on the observable data. We have experienced 100 years of inconsistent yet persistent gradual increase in the sea-level. Neither fear nor denial will protect our coastal property. We have the time and the tools to help us handle water surges of the future. We only need to thoughtfully evaluate the existing data and start the process of improving our coastal resilience.