Early warning in building permits
UF scholar Gustavo Cortes and his co-author traced a century of filings and found a signal that reliably precedes economic booms and busts
Investors, policymakers and journalists track dozens of indicators to gauge the economy’s direction — consumer prices, jobless claims, interest rates, home sales. Yet one signal that quietly precedes nearly every major turn often gets overlooked: building permits.
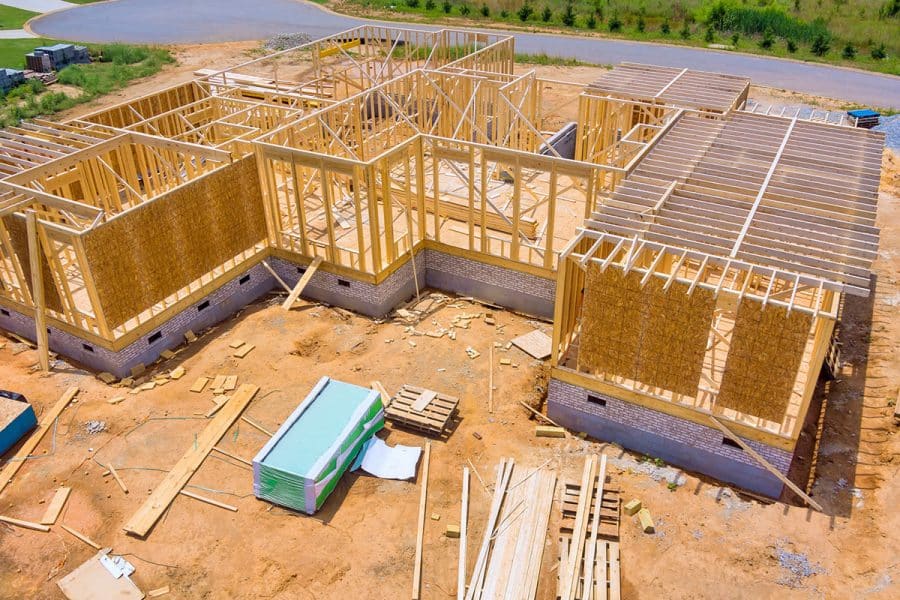
When a developer or homeowner files a permit, it marks a decision point — optimism about future demand, faith in financing, willingness to risk capital. When those filings accelerate, the economy usually follows; when they slow, trouble tends to loom.
In a new paper titled “Housing Is the Financial Cycle: Evidence from 100 Years of Local Building Permits,” University of Florida assistant professor of finance Gustavo Cortes and Yale’s Cameron LaPoint traced building permits across all 50 states and 60 major cities from 1919 to 2019. They found permits act as a forward-looking gauge of risk appetite and economic turning points. The century-long pattern shows up with remarkable consistency: permit surges and reversals preceded the Great Depression, the mid-1970s oil-shock recession and the Global Financial Crisis even after controlling for a wide range of factors such as corporate and household leverage ratios, population growth and industrial production.
The mechanism reveals that permits move before shovels, lending or sales figures. “Before you hit the ground with any construction, you need to get permitted. That moves earlier than everything else,” Cortes said in an interview. He calls permits “an option to build” that developers exercise or shelve as conditions change. In statistical tests spanning a century, “We predict about 12 out of 15 crises,” he said. “There are some false positives. But more often than not, it gets things right.”
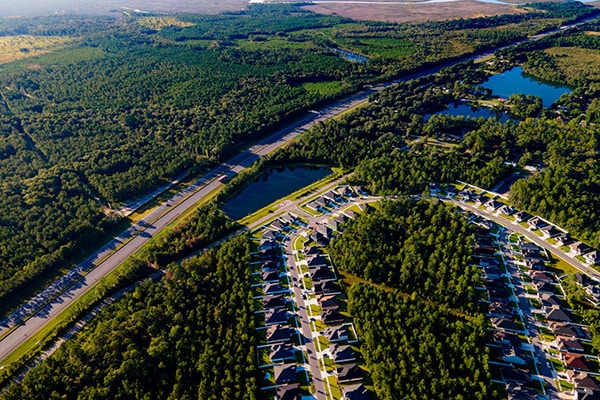
In fast-moving markets with elastic supply like Florida and Texas, the permit signal is especially clear. “Florida ranks on top for every specification we have,” Cortes said. In places with tighter regulations and higher costs, such as San Francisco or Connecticut, the red flag is blurrier. Still, the slope of permit accelerations and slowdowns often provides one of the earliest warnings — months before prices or default statistics catch up. And because the data are local, the signal travels from permitting counters to capital markets with unusual speed.
A century, stitched
Economists have long viewed construction and real estate as a linchpin of the broader economy, so influential that its momentum leads the cycle. A 1939 article by economist Clarence D. Long described the building industry as “the most strategic single factor in making or breaking booms and depressions.”

The insight still holds true today. Cortes discovered the building-permit data while pursuing his doctorate at the University of Illinois, Urbana-Champaign. Deep in the library stacks, he found dusty bound volumes of Dun & Bradstreet’s Review, one of the few surviving sources of local economic data for the pre-World War II era. Its yellowed pages included long tables of monthly business statistics from the 1910s through the 1950s, including a near-continuous record of local building permits. He devoted long days photographing pages and typing numbers into spreadsheets. “I spent about two years of my Ph.D. just hand-collecting the data,” he said, with a laugh.
That painstaking work led to Cortes’ 2019 paper with Chapman University’s Marc Weidenmier in the journal Review of Financial Studies, which examined economic, financial and political variables —including residential and commercial building permits — between 1928 and 1939. They found that stock volatility during the Depression era can be largely explained by two variables: financial leverage and the swings in building permit growth. For example, in April 1929, U.S. building permits rose to $480 million, a 62% increase over the previous year. The measure fell to $260 million in May, to $218 million in June and to $183 million one month before the Great Crash in October 1929. The spike in 1929 appears to be explained, in part, by an increase in the number of new filings for large buildings and skyscrapers in New York City. The 1928–1929 Manhattan “skyscraper boom” saw the construction of the Waldorf-Astoria and the Empire State Building. But overall, only 19 of the 52 planned skyscrapers in 1929 were ever built, as construction spending tanked with the onset of the Depression.
Our main finding is that the volatility of local building permit growth is a strong predictor of future asset market volatility, even after controlling for a wide range of factors such as corporate and household leverage ratios, natural disaster risk, population growth, and other macroeconomic conditions like industrial production.
Gustavo Cortes, Cameron LaPoint, “Housing Is the Financial Cycle: Evidence from 100 Years of Local Building Permits”
After he joined UF, Cortes teamed up with LaPoint to expand the study over 100 years, spanning 1919 to 2019. This presented many challenges. For the first 40 or so years they relied on data from Dun & Bradstreet, then switched to the Census Bureau when the government began tracking building permits. But the Census published this data in different publications, and they had to find a way to merge and splice to make the data consistent. Off-the-shelf optical character recognition (OCR) software mangled the old census tables, so they adapted an algorithm from Harvard economics professor Melissa Dell and her team, originally created to scrape historical newspapers in Japan. Working with Census staff, they scanned, photographed and downloaded PDFs of paper documents, then shifted to government spreadsheets as newer data became available.
They also made key methodological choices to sharpen the signal. They focused on permits rather than more widely tracked housing prices because prices have an inherently backward-looking component. Yes, there is a forward aspect because if people think that the housing market is going to crash, house prices start to plateau and eventually fall. But they also reflect previous transactions. When you go to your house you first compare the sales prices of houses nearby. “That is going to play a role in how much I’m going to price my house,” Cortes said. “This backward aspect in house prices does not contaminate building permits.”
They also focused on single-family home permits because they’re a cleaner signal: 80% to 90% actually get built, compared with commercial projects that face complications like tax considerations. “People are not going to file for a huge office building if they’re not excited about the state of the economy,” Cortes said. “But they’re going to look at other things as well when they’re making that decision. In contrast, single-family homes have a very high execution rate.”
The pattern repeated across decades. Permit growth stalled before the 1973 oil shock, before the 1981 recession, and again in the mid-2000s housing bubble. Each time, filings slowed months ahead of construction starts or employment data. The indicator’s power, Cortes explained, comes from timing. Permits capture what decision-makers believe about the future right before money is committed. “They’re the bridge between expectations and action,” he said. “That’s why they move first.”
After merging decades of data and adjusting boundary and category changes, the pair produced a monthly series for every state and for major metro areas over a century. It’s reportedly one of the longest continuous series of the U.S. construction sector ever assembled. Because permits exist for nearly every local government, the series captures regional dynamics long before national statistics register them.
Florida’s clean signal
Florida’s history illustrates the boom-and-bust pattern with striking clarity. In Miami, building permits surged to $65.7 million in 1925 at the height of the state’s speculative land boom. But by 1928, they plunged to just $1.2 million, as overinflated prices, shipping bottlenecks and a pair of devastating hurricanes (Miami’s in 1926 and Lake Okeechobee’s in 1928) brought Florida’s economy crashing before the Great Depression. The signal repeated decades later: Florida permits peaked five months before the 1973 oil shock, and nearly two years before the 2007–2009 financial crisis.
Geography shapes how clearly the permit signal speaks. In elastic-supply states like Florida, builders can move quickly when demand rises and pause when it fades; permit counts therefore mirror real sentiment. By contrast, tight zoning and high fees mask that signal. “In California fees can be as high as 10% in some parts,” Cortes said. When applications are so costly, only fully funded projects file, so permits’ role in the cycle is less obvious. The researchers ranked states by predictability around the Global Financial Crisis, and they found Florida and other southern states topped the list—the same regions that later proved the most overbuilt. The pattern didn’t mean permits caused the crash, but they registered risk-taking in real time. The combination of high completion rates and fast approval turns Florida into a real-time barometer of national housing conditions. That helps explain why the state’s series predicted national financial volatility better than any other during the 2000s.
The pattern continues in today’s markets. Cortes said permits have flagged emerging slowdowns in several major metros as post-pandemic growth has cooled. He illustrated the pattern with metro-level data for Austin, Jacksonville and Tampa from 2015 to mid-year 2025. He pointed to a slide presentation that showed Austin building surged before and after the pandemic but topped out in 2022, months before price appreciation slowed. In Tampa and Jacksonville, a similar plateau emerged as rising insurance and construction costs bit into margins, he said. (See Figures 1, 2 and 3.) Noting the strong signals found in this newest building-permit data, Cortes said, “This is not just for historians. It’s for people in the market. It makes it clear to the practitioner who wants to predict the state of the economy.” Of course, permit dynamics can’t predict a pandemic or a war, he said, but they are a good signal of how people react once the shock hits.
Single-family home building permits and home values
Seasonally adjusted total new building permits and average house prices from Zillow.
Source: Gustavo Cortes and Cameron LaPoint
Source: Gustavo Cortes and Cameron LaPoint
Source: Gustavo Cortes and Cameron LaPoint
What’s next
Cortes and LaPoint aren’t finished with their work. They’re building a website that will feature interactive graphs with key data, including sector-specific tabs and dashboards linking permits to other metrics such as prices, costs and completions. Their goal is to make permit data a standard tool for economists and market watchers. Researchers can use the information to test, for instance, whether Sun Belt cycles lead the nation or follow it, and how policy shocks ripple through different markets. Agencies such as the Federal Reserve, local governments and financial institutions can integrate the data into forecasting and risk models.
“Being an old-fashioned economic historian like I am, I will tell you that history has shown that it often rhymes. It doesn’t repeat, but it often rhymes,” Cortes said. And, from the skyscraper boom of the 1920s to the Sun Belt surge of the 2020s, the economic refrain often begins with a developer’s decision to file — or not file — a building permit. Given Florida’s role in both the 1920s land boom and the Great Recession, “we should be monitoring building permits over the next few months and the next few years as a good signal of what can happen with the economy.”
Related stories


Sign up for our mailing list
Thank you for submitting this form, %WCBFAFORMFN%
We will contact you shortly.
For the media
Looking for an expert or have an inquiry?
Submit your news
Contact us
Follow us on social
@ufwarrington | #BusinessGators