From the Director

It is with great excitement that I present the University of Florida’s Employment Report for our Full-Time MBA Class of 2021.
Last year, our Class of 2020 demonstrated the highest level of dedication throughout the pandemic and managed to exceed the prior year’s employment outcomes. This year was no different. Second-years, remembering the shade of uncertainty that the pandemic cast over their internship searches, doubled down on their efforts. And our one-year students, some of whom were impacted by the pandemic in their former companies, didn’t waste any time in getting ready for the MBA recruitment season. Thanks to a market rebound, perseverance of our students, and support by alumni, faculty and staff, we managed to build on our 2020 placement success.
This was a record-breaking year for us in terms of our career outcomes both before and after graduation. 100% of students received offers within three months of graduation. 91.3% accepted offers by graduation, and 97.8% accepted offers within three months of graduation.
Top industries for 2021 were Technology, Retail, Consumer Packaged Goods, and Financial services. Top functions were Marketing/Sales, Finance, Human Capital, and Consulting. This year, median base salary held steady at $110,000, with a median signing bonus of $20K.
Students accepted opportunities with 33 companies, making this one of our most diversified employment classes to-date. Finally, we are proud to share that our graduate facilitated placement percentage increased this year, as we have undertaken a concerted effort to teach our students how to leverage their networks to brighten their career horizons both now, and in the future.
Thank you for your investment and interest in the employment outcomes of the UF MBA Full-time program.
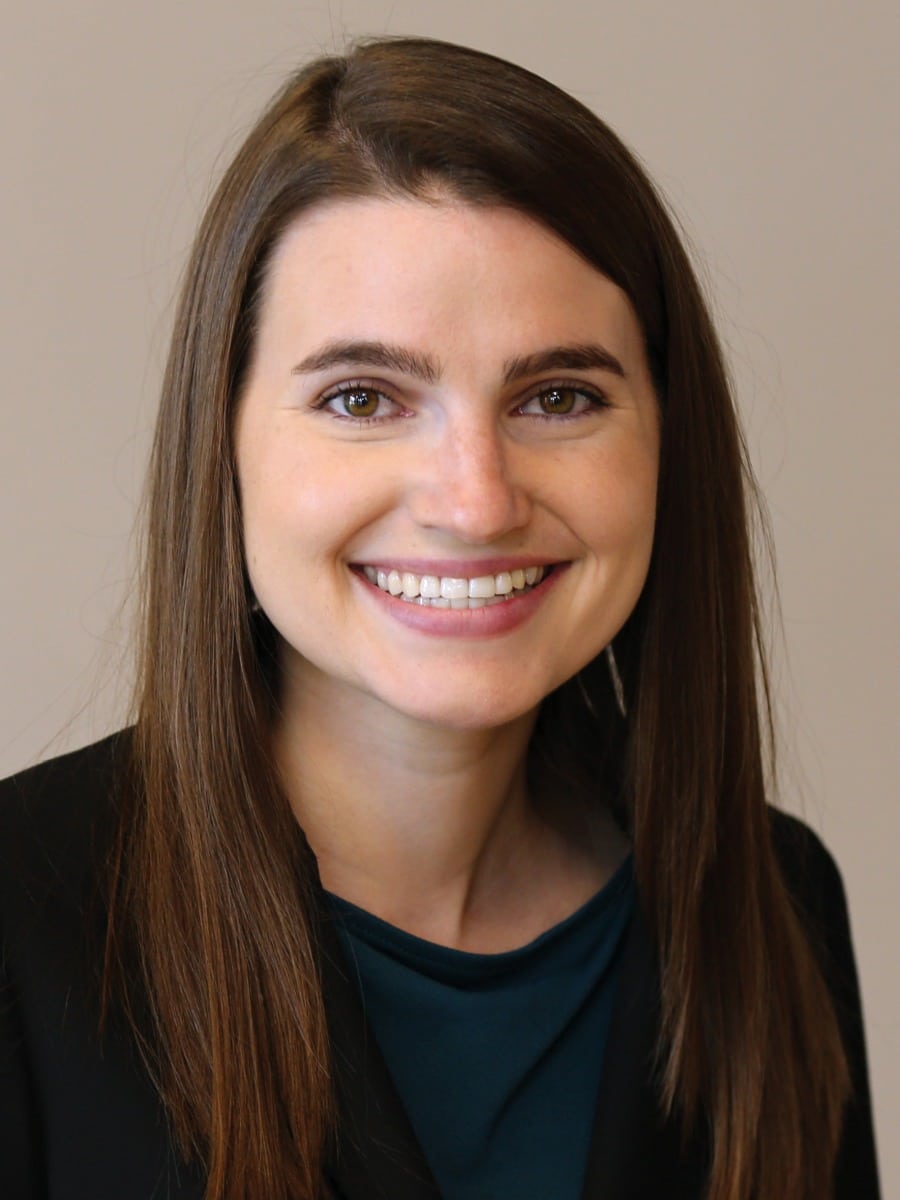
Carly Escue
Director of Graduate Business Career Services
Warrington College of Business
University of Florida
Class Profile id="profile"
| Work authorization categories | Permanent work authorization | Non-permanent work authorization | Total Full-Time MBA graduates |
|---|---|---|---|
| Seeking employment | 44 | 2 | 46 |
| Company sponsored | 2 | 0 | 2 |
| Continuing education | 0 | 0 | 0 |
| Postponing job search | 0 | 0 | 0 |
| Starting a new business | 1 | 0 | 1 |
| Not seeking for other reasons | 7 | 0 | 7 |
| Total not seeking employment | 10 | 0 | 10 |
| No recent info available | 0 | 0 | 0 |
| Total graduates | 54 | 2 | 56 |
Employment Highlights
Hiring percentages:
- Accepted at graduation: 91.3%
- Accepted within 3 months of graduation: 97.8%
- Job offers at graduation: 95.6%
- Job offers within 3 months of graduation: 100%
Top employers:
- Microsoft
- Procter & Gamble
- Ryder
- The Home Depot
- 3M
Top industries:
- Technology
- Consumer products
- Financial services
- Retail
UF MBA Full-Time Rankings
Job Offers & Acceptances id="offers-acceptances"
Timing of First Job Offers
| Status | Total seeking jobs | Offers by graduation | Offers by 3 months after graduation | No offers reported by 3 months post graduation |
|---|---|---|---|---|
| Permanent work authorization | 44 | 42 / 95.4% | 2 / 4.5% | 0 / 0% |
| Non-permanent work authorization | 2 | 2 / 100% | 0 / 0% | 0 / 0% |
| Total graduates seeking employment | 46 | 44 / 95.6% | 2 / 4.3% | 0 / 0% |
Timing of First Job Acceptances
| Status | Total seeking jobs | Accepted by graduation | Accepted by 3 months after graduation | No acceptance reported by 3 months post graduation |
|---|---|---|---|---|
| Permanent work authorization | 44 | 40 / 90.9% | 3 / 6.8% | 1 / 2.2% |
| Non-permanent work authorization | 2 | 2 / 100% | 0 / 0% | 0 / 0% |
| Total graduates seeking employment | 46 | 42 / 91.3% | 3 / 6.5% | 1 / 2.1% |
Notes:
- Only includes data for outcomes achieved within 3 months of the student’s graduation date.
- The number of students listed under Total Seeking Jobs does not include students who are company-sponsored, continuing education, postponing job search, starting a new business, or not seeking for other reasons.
- Permanent Work Authorization is defined as the student being a citizen or permanent resident of the country where attending school.
- This report has been developed in accordance with the MBA CSEA FTMBA employment reporting standards.
Business Career Services helped me identify my true strengths and gave me the confidence to share my success with all recruiters. Without Business Career Services, I wouldn’t have found the perfect role after my MBA.
2021 MBA Graduate

Primary Source of Full-Time Job Acceptance
School-Facilitated Activities
| Source | Number |
|---|---|
| Career fair (campus) | 2 |
| Career fair (national) | 8 |
| Campus events | 4 |
| School job board | 2 |
| Other school-facilitated source | 1 |
| Resulted from internship | 5 |
Total school-facilitated sources
Graduate-Facilitated Activities
| Source | Number |
|---|---|
| Career fair (national) | 1 |
| External job boards | 6 |
| Alumni outreach/referrals | 5 |
| Other | 3 |
| Personal former employer | 2 |
| Personal friend/family network | 2 |
| Resulted from internship | 4 |
Total graduate-facilitated sources
Compensation id="compensation"
Base Salary
| Status | Number reporting base salary | Percent reporting base salary [1] | Median | Mean | Low | High |
|---|---|---|---|---|---|---|
| Permanent work authorization | 40 | 100% | $100,000 | $106,083 | $60,000 | $165,000 |
| Non-permanent work authorization | 2 | 100% | I/D | I/D | I/D | I/D |
| Total reporting base salary | 42 | 93.3% | $110,000 | $106,984 | $60,000 | $165,000 |
[1] Divide number of students reporting base salary by the number of students reporting accepting a position.
Signing Bonus
| Status | Number reporting signing bonus | Percent reporting signing bonus [2] | Median | Mean | Low | High |
|---|---|---|---|---|---|---|
| Permanent work authorization | 30 | 69.7% | $17,500 | $22,309 | $5,000 | $55,000 |
| Non-permanent work authorization | 2 | 100% | I/D | I/D | I/D | I/D |
| Total reporting signing bonus | 32 | 71.1% | $20,000 | $23,258 | $5,000 | $55,000 |
[2] Divide number of students reporting signing bonus by the number of students reporting accepting a position.
North America
| Region | Mean base salary | Low base salary | High base salary |
|---|---|---|---|
| Mid-Atlantic | I/D | I/D | I/D |
| Midwest | $107,415 | $80,000 | $125,000 |
| Northeast | I/D | I/D | I/D |
| South | $101,735 | $60,000 | $130,000 |
| Southwest | $94,022 | $70,110 | $118,000 |
| West | $115,000 | $90,000 | $120,000 |
| North America | $105,783 | $60,000 | $135,000 |
Notes:
- The percentage of students for whom there is usable salary information is 93.33%. This calculation is made by dividing the number of job-accepting graduates for whom you have usable salary information/total job-accepting graduates.
- I/D refers to instances with insufficient data. MBA Standard guidelines require a minimum of three data points for each category and that the number of data points is equal to or greater than one percent of full-time graduates seeking employment. Data points not meeting both requirements will still display the number of employed graduates, but will show “I/D” for all salary calculations.
- Accepted offers with remote locations are excluded from calculations.
With its strong network of alumni, the UF MBA program allowed me to gain real insights into opportunities I was interested in. I was able to successfully transfer my skills into an entirely different industry and role.
2021 MBA Graduate

By Industry
| Function | Graduates accepting new employment | Graduates reporting salary | Median base salary | Mean base salary | Low base salary | High base salary |
|---|---|---|---|---|---|---|
| Consulting | 3 / 6.7% | 2 | I/D | I/D | I/D | I/D |
| Consumer products | 6 / 13.3% | 6 | $110,000 | $120,833 | $110,000 | $165,000 |
| Energy | 2 / 4.4% | 2 | I/D | I/D | I/D | I/D |
| Financial services | 6 / 13.3% | 6 | $97,500 | $97,500 | $60,000 | $135,000 |
| Healthcare | 3 / 6.7% | 2 | I/D | I/D | I/D | I/D |
| Manufacturing | 4 / 8.9% | 4 | $105,868 | $108,434 | $97,000 | $125,000 |
| Real estate | 1 / 2.2% | 1 | I/D | I/D | I/D | I/D |
| Retail | 7 / 15.6% | 6 | $110,000 | $107,500 | $90,000 | $130,000 |
| Technology | 8 / 17.8% | 8 | $120,000 | $116,063 | $100,000 | $130,000 |
| Transportation | 3 / 6.7% | 3 | $110,000 | $108,667 | $106,000 | $110,000 |
| Other | 2 / 4.4% | 2 | I/D | I/D | I/D | I/D |
| Total Reporting | 45 / 100% | 42 | $110,000 | $106,984 | $60,000 | $165,000 |
By Function
| Function | Graduates accepting new employment | Graduates reporting salary | Median base salary | Mean base salary | Low base salary | High base salary |
|---|---|---|---|---|---|---|
| Consulting | 6 / 13.3% | 5 | $90,000 | $94,000 | $85,000 | $110,000 |
| Finance / Accounting | 9 / 20% | 9 | $110,000 | $105,193 | $62,000 | $135,000 |
| General management | 4 / 8.9% | 4 | $120,000 | $112,500 | $80,000 | $130,000 |
| Human resources | 7 / 15.6% | 6 | $100,000 | $91,685 | $60,000 | $110,000 |
| Info technology | 0 / 0% | 0 | I/D | I/D | I/D | I/D |
| Marketing / Sales | 10 / 22.2% | 10 | $110,000 | $108,950 | $75,000 | $125,000 |
| Operation / Logistics | 5 / 11.1% | 5 | $120,000 | $125,400 | $97,000 | $165,000 |
| Others | 4 / 8.9% | 3 | $120,000 | $120,000 | $120,000 | $120,000 |
| Total Reporting | 45 / 100% | 42 | $110,000 | $106,984 | $60,000 | $165,000 |
Notes:
- The percentage of students for whom there is usable salary information is 93.33%. This calculation is made by dividing the number of job-accepting graduates for whom you have usable salary information/total job-accepting graduates.
- The following industry values were excluded due to having no data points: Government, Entertainment, Hospitality, Non-Profit.
- I/D refers to instances with insufficient data. MBA CSEA Standard guidelines require a minimum of three data points for each category and that the number of data points is equal to or greater than one percent of full-time graduates seeking employment. Data points not meeting both requirements will still display the number of employed graduates, but will show “I/D” for all salary calculations.
Recognition id="recognition"
Poets and Quants Award Winners

Rachelle Antoine
MBA Grad to Watch

Kristyn Cadwell
Best and Brightest

Perry Dube
MBA Grad to Watch

Mikaela Medeiros
MBA Grad to Watch
University of Denver “Race & Case” Case Competition

Top Team Presentation & 2nd Place Overall:
- Kristyn Cadwell
- Chelsea Creech
- Russell Gardiner
- Tyler Palov
Compliance Statement: This report has been developed in accordance with the Full-time MBA employment data standards provided by the MBA Career Services and Employer Alliance (CSEA).
